Research x Experience design x Prototyping x User testing


Project brief
IDM is a platform that enables remote monitoring of devices which are deployed in multiple locations by Philips. It constantly tracks the devices and takes in service requests which need to be resolved in a time frame for optimal functioning of the devices.
Project goals
Research
Stakeholder interviews, user interviews , Shadowing the users in their working environment.
Analysing Insights
Affinity mapping , empathy personas, Information architecture
Design
Scnearios, task flows, Low fidelity wireframes, high fidelity wireframes.
Validation
User testing, Refining designs based on usability test insights.
Development
Working closely with the development team on final designs.
The research phase of the project lasted for two weeks where we conducted semi-structured interviews with the IDM users in their work environment to understand their work and challenegs better. These interviews were followed by some sessions of shadowing the users in their work environment to see how they manage and resolve various tasks at hand.
To capture the business requirements, we met with the business stakholders to understand their vision for the product. Project goals were defined as a result of the meeting with business.

IDM user workspace

Individual user workspaces with multiple devices

Shadowing the user

Users maintaining manual loga
The analysis phase included gathering and organising all the data captured from two weeks of research. We used affinity diagramming as the primary tool to organise data into larger insights. An empathy persona was also created to identify the IDM user and their deeper challenges and pain points. Later, a journey map was created to translate all the insights into a linear journey of the user to make sense of the data in a more logical and linear format. This was primarily done as we observed that many insights were interconnected and dependent on each other.


The entire IDM Monitoring end to end user journey was mapped with all the Stages, identified pain points at each stage and characteristics of each of the stages. The journey map led us to identify the opportunity areas and loopholes at every stage.

After analysing all the data, three key design Principles were identified based on which the final designs took shape.

The user was using three screens to monitor, filter and resolve the service requests. Every 3 mins the user would get atleast 50 service requests. Along with this all their work was scattered in multiple applications. They were using excel sheets to sort and filter the immense volume of data which they chose to refresh every half an hour.
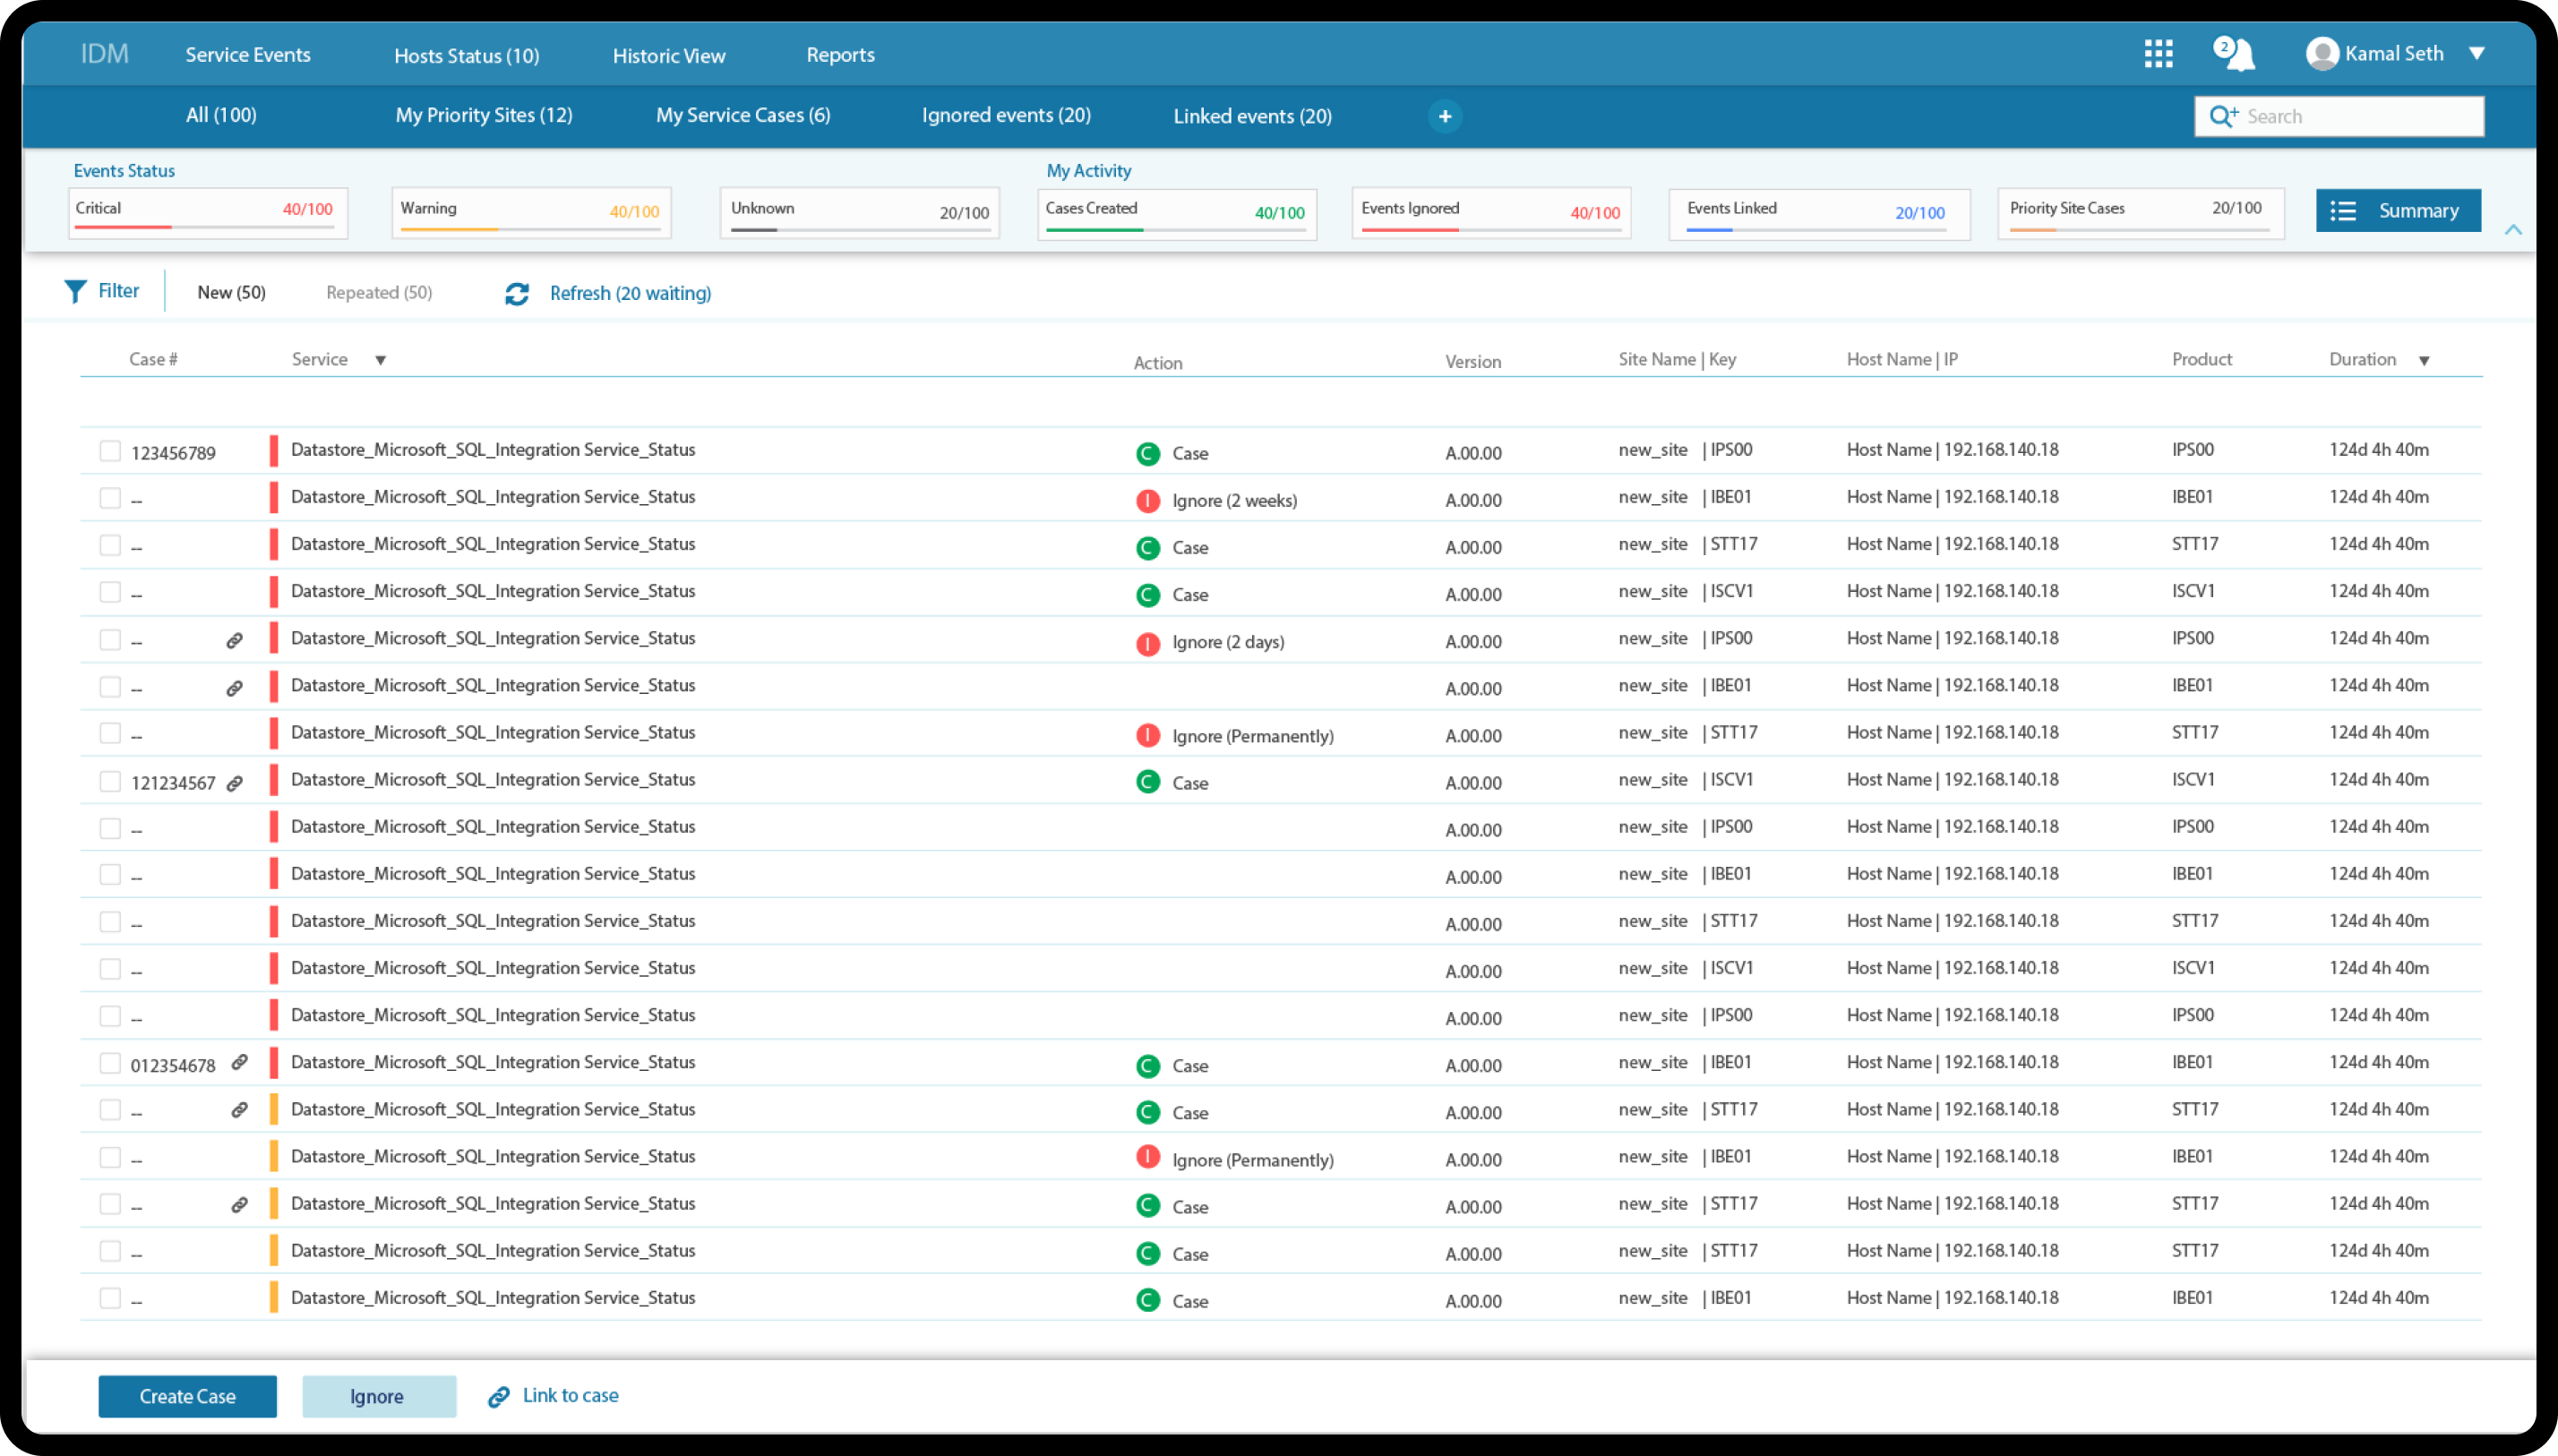
After multiple iterations, the final design reduced the user’s work to only one screen and one application. Summative user tests were conducted to validate the designs. There was less multi - tasking and users didn’t have to document data separately in other applications. It saved them time and increased the overall efficiency of team.
IDM users were using multiple channels to resolve one ticket, which took them longer and was more prone to errors. With the refined designs , they could perform all their functions from one application, which reduced errors and saved time.

Monitoring dashboard

Filtering of service events

Creating a service case

Ignored cases